Hello!
This post is from Daniel Oala, a friend of mine. I'm posting this here to help him bring more exposure to his work. It's something quite different in comparision to what I usually do, but I hope you'll like it.
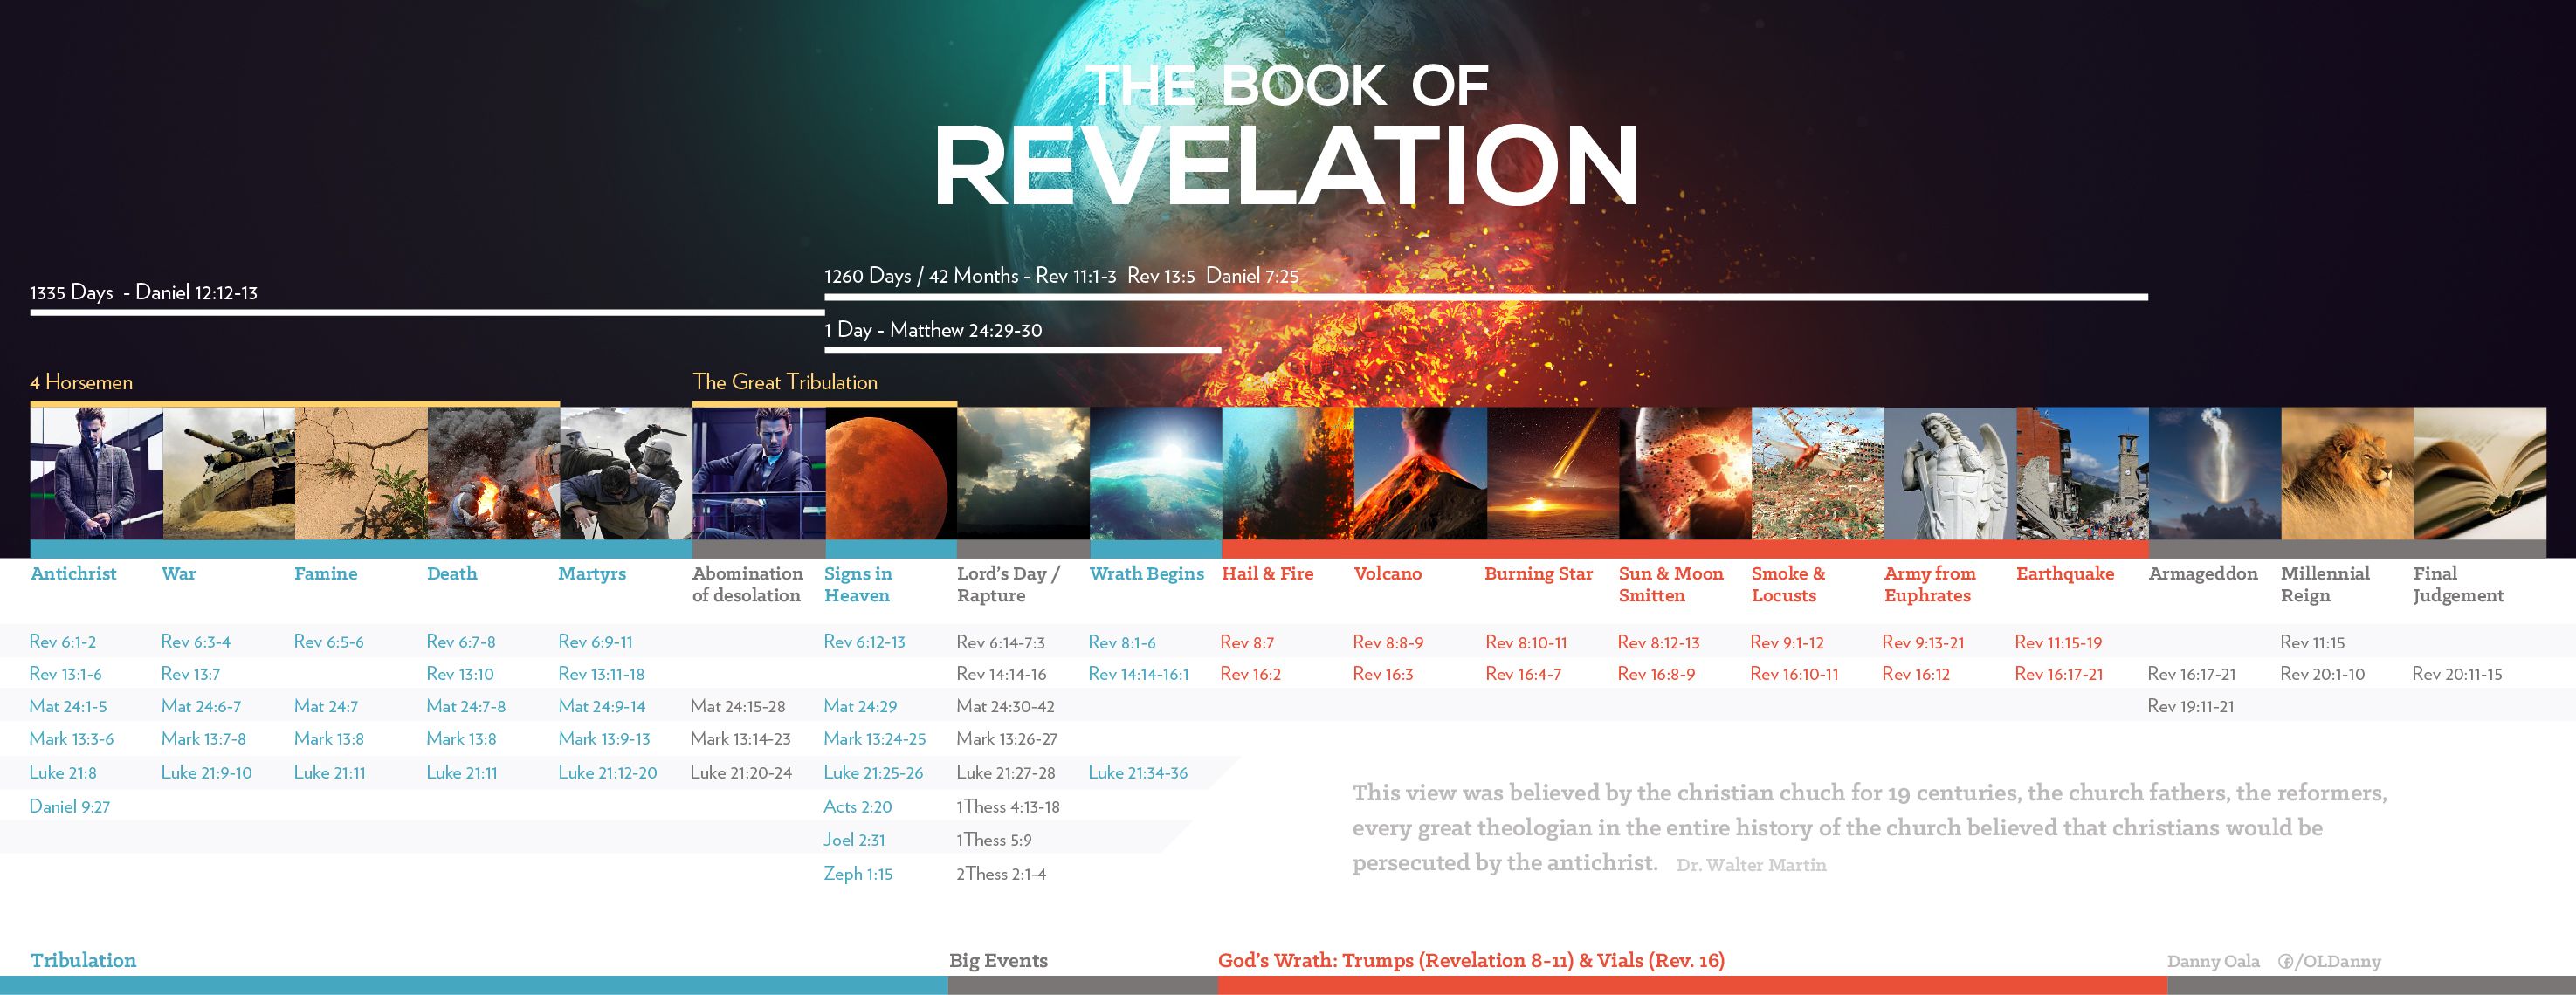
Book of Revelation chart:
The purpose of this project was to make a clear chart about the events in the book of Revelations which has fascinated Christians for centuries and to raise points against the pre-tribulation theory created by John Nelson Darby. This chart is supporting "historic pre-millennialism", the classic Christian theory of the end-times.
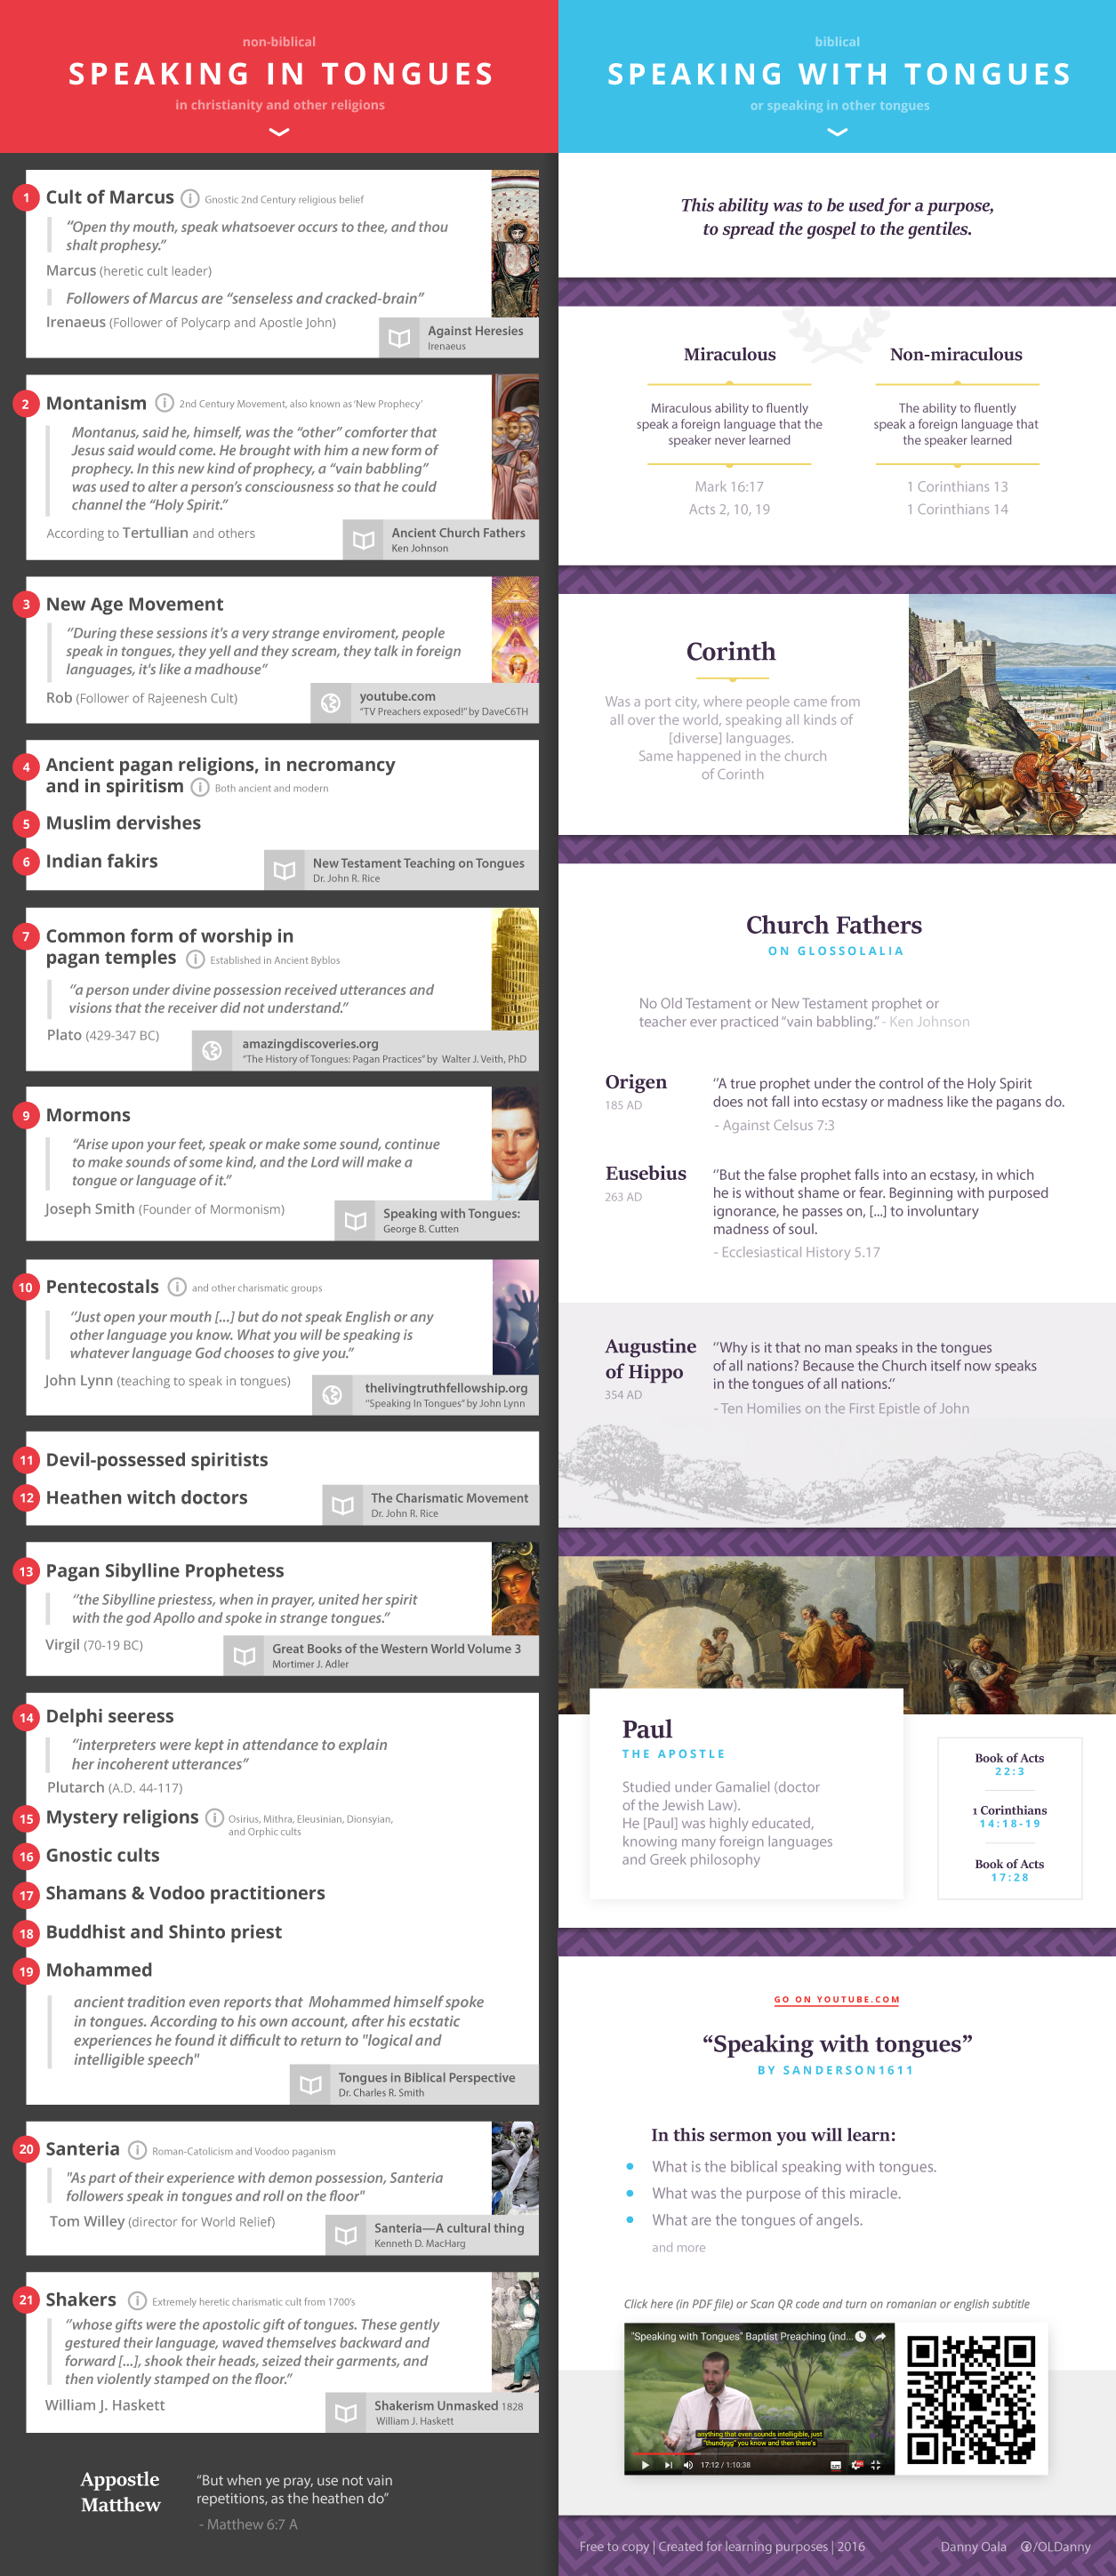
Speaking with tongues chart:
After studying different religions (christian and non-christian) the chart was created to sum up the months of study in an easy-to-read chart that challenges the glossolalia doctrine and offers some biblical answers to the "speaking with tongues" subject matter.
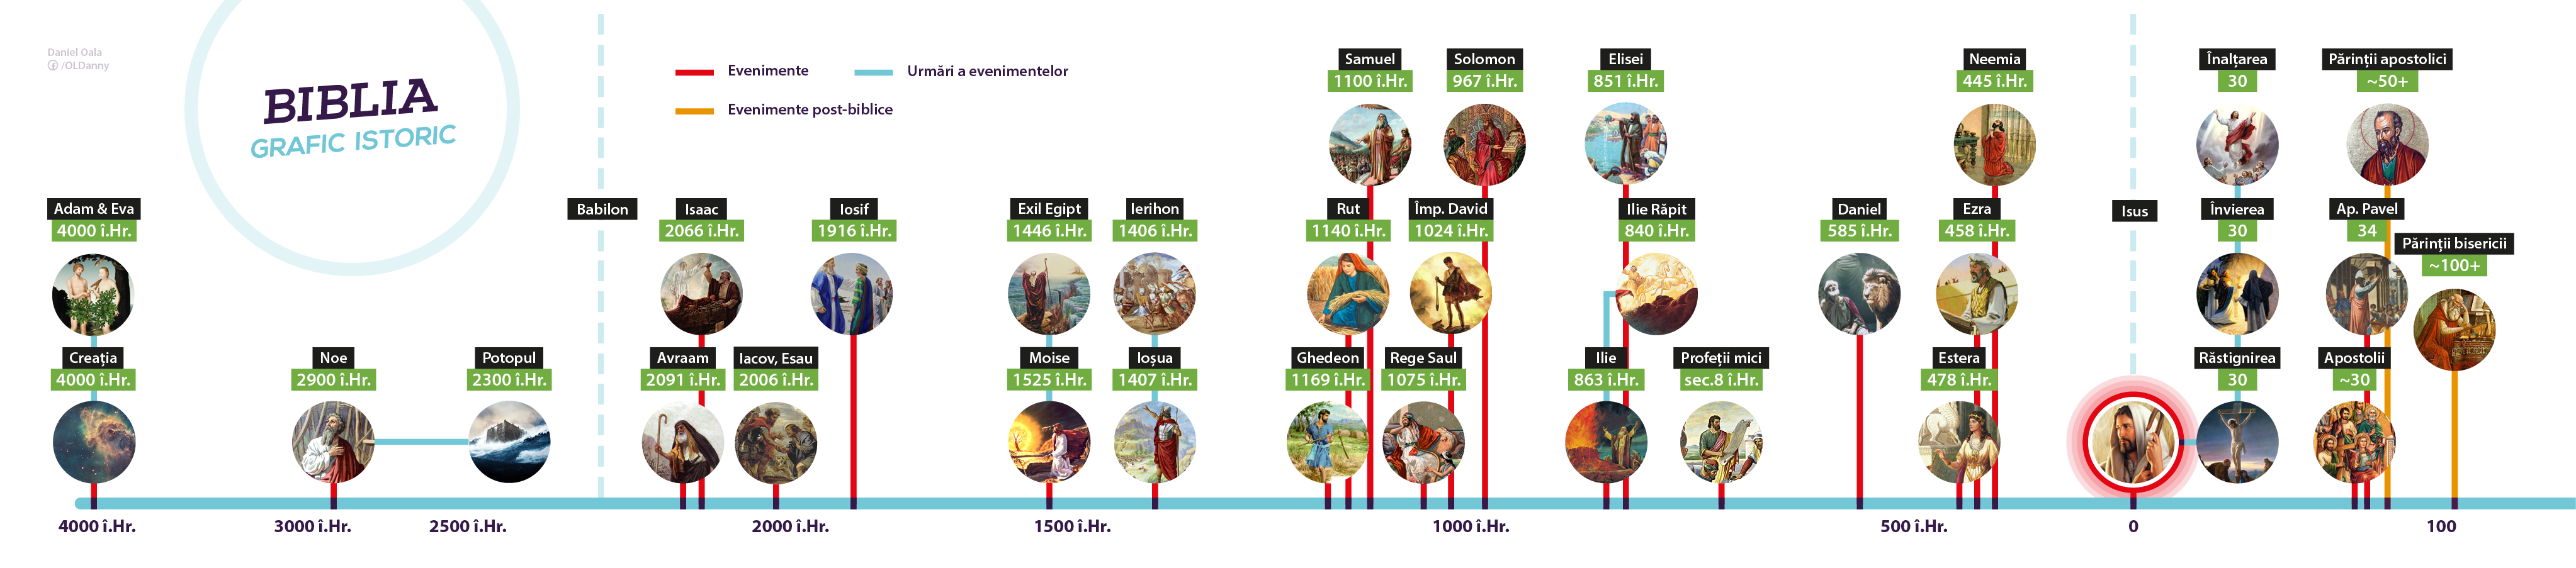
Timeline of biblical events:
A simple chart of the main historical events in Christianity meant to help the readers form a perspective on the unfolding of the biblical events. The texts in the image are written in Romanian.
Note. These charts contain stock photos.
